Beyond the Dashboard: Why Manual Monitoring Is a Business Risk
Dashboards are not operations. Learn why manual monitoring delays incident response and how SMEs and startups can move toward practical observability, runbooks, and owned digital operations.
Contents
Dashboards are not operations. Learn why manual monitoring delays incident response and how SMEs and startups can move toward practical observability, runbooks, and owned digital operations.
Share this article
The Friday failure nobody sees until Monday
On Friday evening, a small update ships to a service company's website. The homepage loads. The host reports green. The monitoring dashboard shows no red status. What nobody sees: the contact form still accepts submissions, but no confirmation email is sent and no lead is written to the CRM.
On Monday morning, sales asks why no qualified leads came in over the weekend. Now the cleanup starts: test the form, inspect the mailbox, check CRM logs, call the developer, reconstruct the window of impact, and look for missing inquiries. The failure was not a lack of data. The failure was that no operating system watched the business workflow end to end.
This is manual monitoring in practice. Someone checks a dashboard, a tool, or an inbox and hopes the important exception becomes visible in time. It feels responsible, but it is still a habit built on human attention. When the failure happens after hours, during vacation, or between owners, the customer may become the detection system.
Why dashboards feel safe but leave the business exposed
A dashboard answers questions. It shows metrics, logs, status, or historical executions. That is useful for analysis and debugging. It is not the same as operations. Monitoring becomes operational only when a relevant signal reaches an owner, follows an escalation path, and triggers a known action.
The Google SRE Book (Chapter 6) makes this distinction cleanly: dashboards help teams ask and answer questions; alerting says something is broken and somebody needs to fix it now. For startups and lean teams, that distinction matters. A server can return HTTP 200 while the contact form, CRM token, invoice export, or backup restore path is broken.
Visibility is not detection
Many systems are visible without being monitored. Hosting has a dashboard. CRM has a dashboard. n8n has execution logs. Finance tools have export screens. Each tool holds part of the truth, but none of them automatically owns the business outcome.
The useful question is: how do you know the intended workflow result actually happened? For a lead flow, that means more than page uptime. It means form submitted, confirmation sent, CRM record created, owner notified, and follow-up possible. If you monitor only the server, you miss the chain.
Human attention does not scale across workflows
Manual checks work while the stack is small and one technically fluent person keeps the model in their head. Then the company adds SaaS tools, automations, contractors, holiday cover, new roles, and undocumented integrations. The mental model breaks before anyone admits it.
The Atlassian Incident Management Guide favors alerting tools and rosters over dependence on a specific individual for exactly this reason. People take vacation, burn out, switch roles, or sit in customer calls. A Digital Headquarters has to assume that reality and design around it.
Alert noise trains teams to ignore the signal
The opposite failure is just as dangerous: too many alerts. If every minor event sends an email, the team learns to ignore the channel. Manual monitoring returns through the back door, just with more noise.
Good operational signals are few and sharp. They focus on symptoms that affect users or the business: a lead is not created, a sync is stuck, a payment path breaks, an export misses its window, or a backup cannot be restored. Not every log entry deserves a human.
The cost of watching screens instead of running operations
Manual monitoring turns reliability into memory, routine, and intuition. That is not a stable operating model. The real cost is rarely the outage alone. It is the delay before the outage is detected, understood, contained, and turned into a better process.
Downtime cost numbers should be handled carefully. The Uptime Institute Annual Outage Analysis reports high costs for many significant outages, while also warning that outage reporting is commercially sensitive and inconsistent. For an SME or SaaS startup, the practical cost model is more grounded: missed leads, delayed invoices, manual reconstruction, emergency engineering work, and weaker confidence in the digital channel.
Temporal cost: every incident starts with detection delay
If a failure is found on Monday, the team is not only fixing code. It is finding the start time, reconstructing data, communicating impact, rerunning automations, and checking whether adjacent workflows were affected.
The Atlassian Incident Management Guide treats Time to Detect (TTD) and Time to Recover (TTR) as important incident metrics. Lean teams should do the same. If you do not know when impact started, when it was detected, and when it ended, the next incident will likely repeat the same blind spot.
Financial cost: downtime is only the visible line item
A broken lead form does not only cost the missing inquiry. It costs sales time, rework, developer interruption, management attention, and often ad spend that kept running while the funnel was broken.
The ITIC Hourly Downtime Survey includes smaller-business examples where even modest hourly losses become material quickly. Those examples are not universal benchmarks. They simply show why "a few hours" can be expensive when the workflow touches revenue.
Trust cost: customers notice before the dashboard does
The hardest incident is the one a customer reports first. The company is no longer proactively explaining. It is reacting, apologizing, and trying to prove that the digital service is under control.
The PwC Trust Survey 2024 frames trust as evidence-based, including how organizations protect sensitive information and explain what they do. Operational reliability sits inside that trust. It is not just a technical metric; it is part of the promise customers experience.
The operational signal map
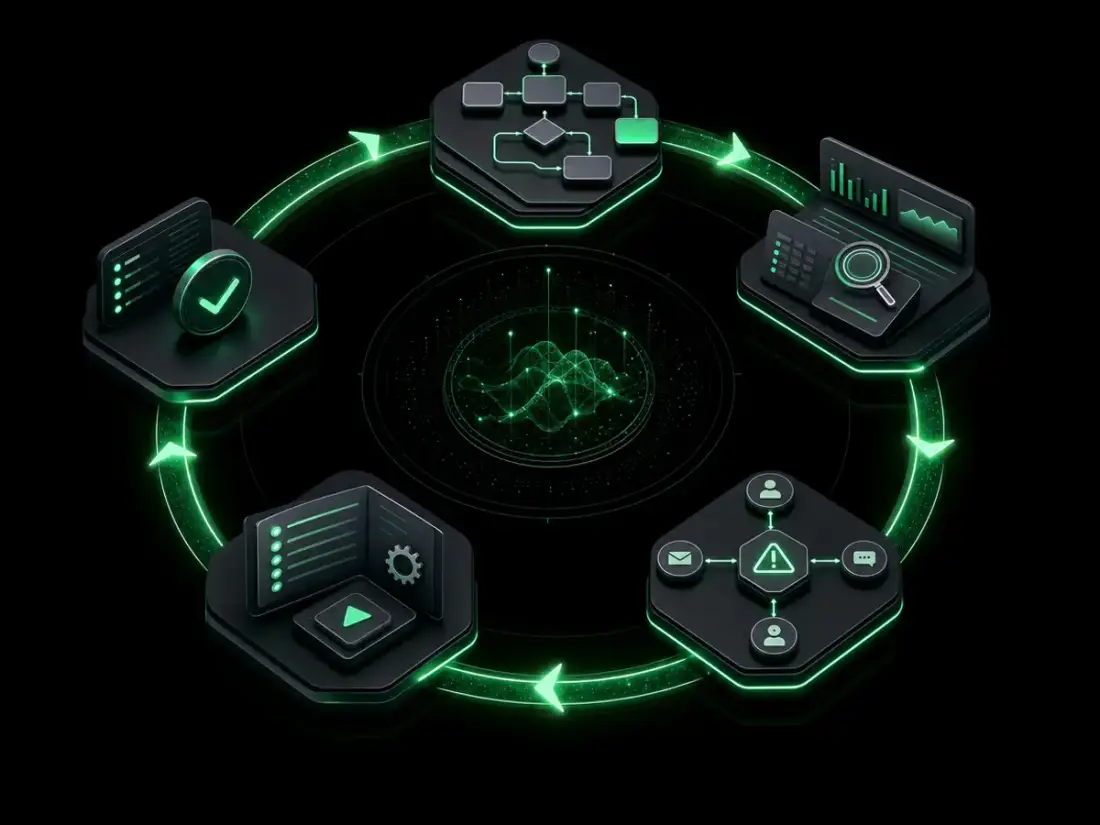
A practical monitoring model does not start with tools. It starts with the workflow that must not fail silently. Then the team defines the signal, the threshold, the owner, the escalation route, the runbook, the incident evidence, and the review loop.
The model is simple: critical workflow -> observable signal -> threshold -> owner -> escalation -> runbook -> evidence -> review. Once that chain exists, a dashboard can support operations instead of pretending to be operations.
Critical workflow signals
Signals should stay close to the business. A contact form can be tested synthetically: submit a test inquiry, verify confirmation, expect a CRM record, and alert if a step fails. A CRM sync can compare "lead captured" with "lead visible." An invoice export can alert if no success event appears before a defined time.
The Google SRE Book (Chapter 6) defines four golden signals for user-facing systems: latency, traffic, errors, and saturation. Translated into startup operations, those become workflow timing, successful completions, failed submissions, queue backlog, repeated API failures, and restore verification failures.
Ownership and escalation
An alert without an owner is only noise. Define who makes the first assessment, who can change the system, when a vendor is involved, and how handover works during vacation or role changes.
For a small team, the founder should not be the permanent alert router. That is where a managed operating layer matters. Planfold can run the signal routing and runbook layer while the client keeps documentation, portability, and architectural transparency.
Runbooks and evidence
A runbook does not need to be a 40-page manual. Often it is one focused page: what happened, where to inspect status, which steps are allowed, when to escalate, and what evidence to keep.
The NIST SP 800-34 Contingency Planning Guide emphasizes testing, exercises, and maintenance. In practical startup terms: a green backup job is not proof of recoverability. A documented restore test is.
Proof: From manual checks to managed operational signals
Let us analyze a concrete scenario: A specialized HVAC and solar engineering firm with 28 employees. Every week, they receive approximately 120 qualified project inquiries via their website form and a shared email inbox. Sabine, the owner and managing director, has digitized the firm's operations. The team utilizes a website with inquiry forms, a CRM for client management, n8n for workflow automation, and cloud tools for project dispatching. In practice, however, they face a common problem: every system has its own dashboard, but nobody can verify whether the critical inquiry-to-dispatching process works end-to-end.
Before: A business that waits for symptoms
In the unstructured "before" state, the digital infrastructure operates blindly. Sabine occasionally checks the n8n execution lists when she remembers. One Friday evening, the CRM API token expires. While the website continues to accept inquiries and the host uptime check remains green, the automated handoff of HVAC planning requests fails silently.
Only on Tuesday afternoon does the team notice the lack of incoming leads. Hectic troubleshooting begins: checking server logs, manually testing API status, filtering failed n8n executions, and painstakingly reconstructing lost inquiries. Meanwhile, several prospects have moved to competitors. The incident costs hours of engineering time and weakens confidence in the digital channel. Uptime dashboards were green, but structured detection was completely absent.
After: A digital machine with response paths
Planfold moves the business to a managed signal model. The entire inquiry process is mapped inside n8n. If an error like an expired API token occurs, a dedicated n8n error workflow immediately captures the event and routes a sharp alert to Markus, the Operations Lead. The alert contains the exact failure type and a direct link to the failed n8n execution.
In addition, Planfold implements clear decision points and approval gates:
- Decision Point: Incoming HVAC planning inquiries with an estimated value exceeding 25,000 EUR are automatically classified as high-priority and routed to a dedicated CRM board.
- Review Gate: For these high-priority inquiries, the n8n pipeline drafts an initial offer based on customer input and historical project data. This draft is placed in an approval gate. Sabine reviews and approves the draft within the n8n dashboard before it is sent to the client.
- Audit Trail: Every automated decision, system alert, and manual approval by Sabine is recorded in a secure, tamper-proof audit trail.
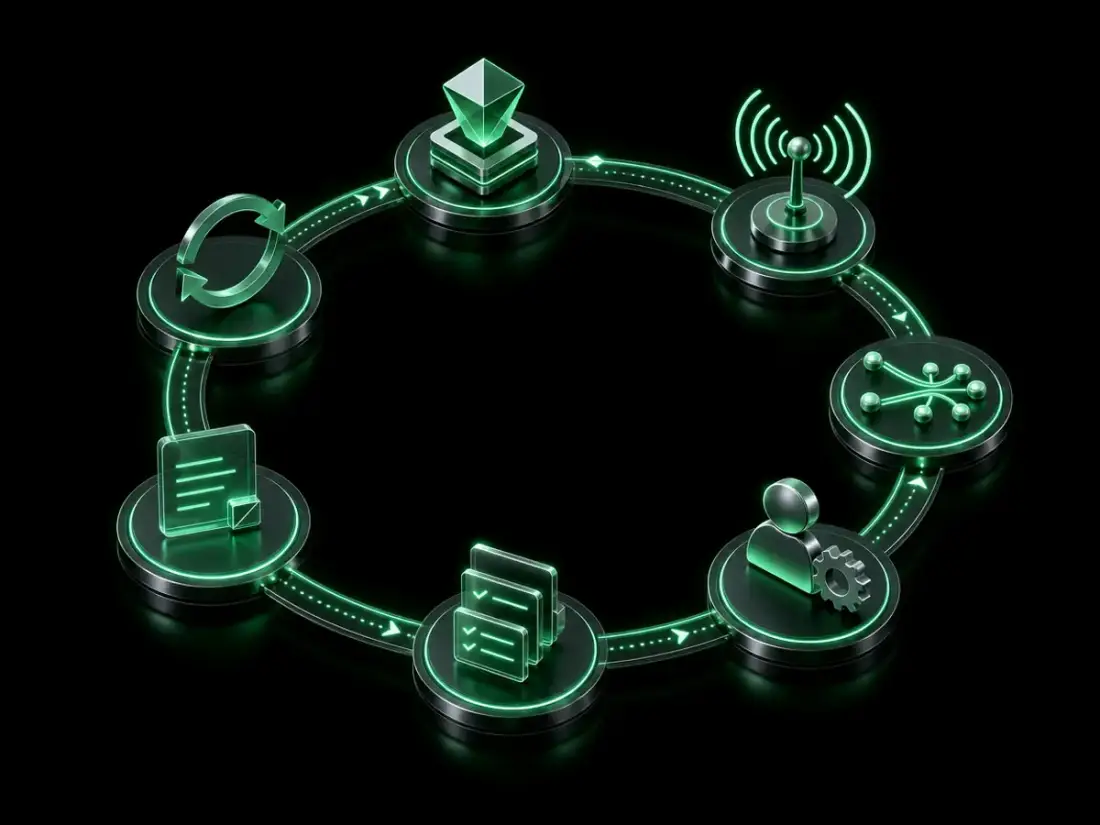
n8n supports parts of this model with execution statuses, retries, and error workflows. That does not guarantee detection for every failure mode. It does turn "someone should look at the dashboard" into a signal with a route.
How Planfold frames reliable digital operations
Planfold treats monitoring as part of the operating model, not a separate checkbox. It belongs with architecture, workflows, owners, runbooks, evidence, and the digital layer where decisions are made.
For startups, SaaS teams, and technical operators, the goal is not enterprise SRE theater. The goal is a lean Digital Headquarters: a place where critical signals, ownership, and response paths stay connected without burying the team in process.
Plan: Map what must not fail silently
The Plan phase identifies critical workflows, dependencies, owners, and failure conditions. Which inquiry creates revenue? Which export triggers billing? Which automation must not hang unnoticed? Which restore path has to be tested?
The output is not a tool list. It is a ranked operating map. Once the team knows what "broken" means for a workflow, it can choose the smallest useful signal.
Unfold: Build monitoring into the system
The Unfold phase turns the map into checks, telemetry, alert routing, runbooks, logs, backup verification, and handover paths. The tooling is not decorative. It is built into the workflow.
This matters most between systems: n8n, CRM, finance tools, website forms, payment paths, and SaaS APIs. Many critical failures happen in the handoff, not inside a single application.
Resonate: Turn incidents into operating learning
After an incident, the system should get better. Was detection late? Was the alert noisy? Did the runbook miss a step? Which fact would have helped the team move faster?
Resonate means feeding those answers back into documentation, signals, and ownership. That is how a small team stays fast without letting failures hide in dashboards.
A practical starting point for SMEs and startups
Do not start with ten tools. Start with one revenue-critical workflow. For many companies, that is inquiry capture, booking, payment, invoicing, or the automated handoff into CRM.
Write the workflow down plainly: trigger, expected outcome, success signal, failure signal, owner, escalation path, runbook, evidence retained, and review cadence. If those nine points are unclear, the workflow is not operationally owned yet.
Start with one critical workflow
Choose the path where a silent failure would hurt most. Do not only test whether the website loads. Test whether the customer intent reaches the system where someone can act on it.
One owned workflow creates more reliability than five more dashboards. It reveals which technical signals actually matter to the business.
Define the signal before choosing the tool
Many monitoring efforts start in the wrong order. First the team buys a tool, then it decides what the tool should say. Reverse it: business event, failure condition, owner, response, then tooling.
That keeps operations lean. You avoid alert noise and build a few signals that drive real decisions.
The real outcome: a business that finds problems before customers do
Manual monitoring is not risky because people are careless. It is risky because modern business workflows have too many dependencies to keep reliably in one person's head.
A robust operating model turns scattered dashboards into a clear chain: what matters, which signal counts, who responds, what happens next, and what evidence remains. That is where a Digital Headquarters becomes practical. Not another dashboard, but a system that sees earlier, escalates clearly, and learns from incidents.